Skip to main content
facebook
instagram
twitter
linkedin
Commercial and Industrial Electricians in Nottingham & Derby
0115 647 0335
or
WhatsApp Us
Services
Electrical Installation Contractor
Emergency Electrician
Industrial & Commercial
Testing and Inspections
Lighting Services
Blog
About us
Meet the team
Carl
Ricky
Harry
Marie
Service areas
Data Protection and Privacy Policy
Terms and Conditions
Reviews
Careers
Knowledge Centre
Contact us
Online Booking
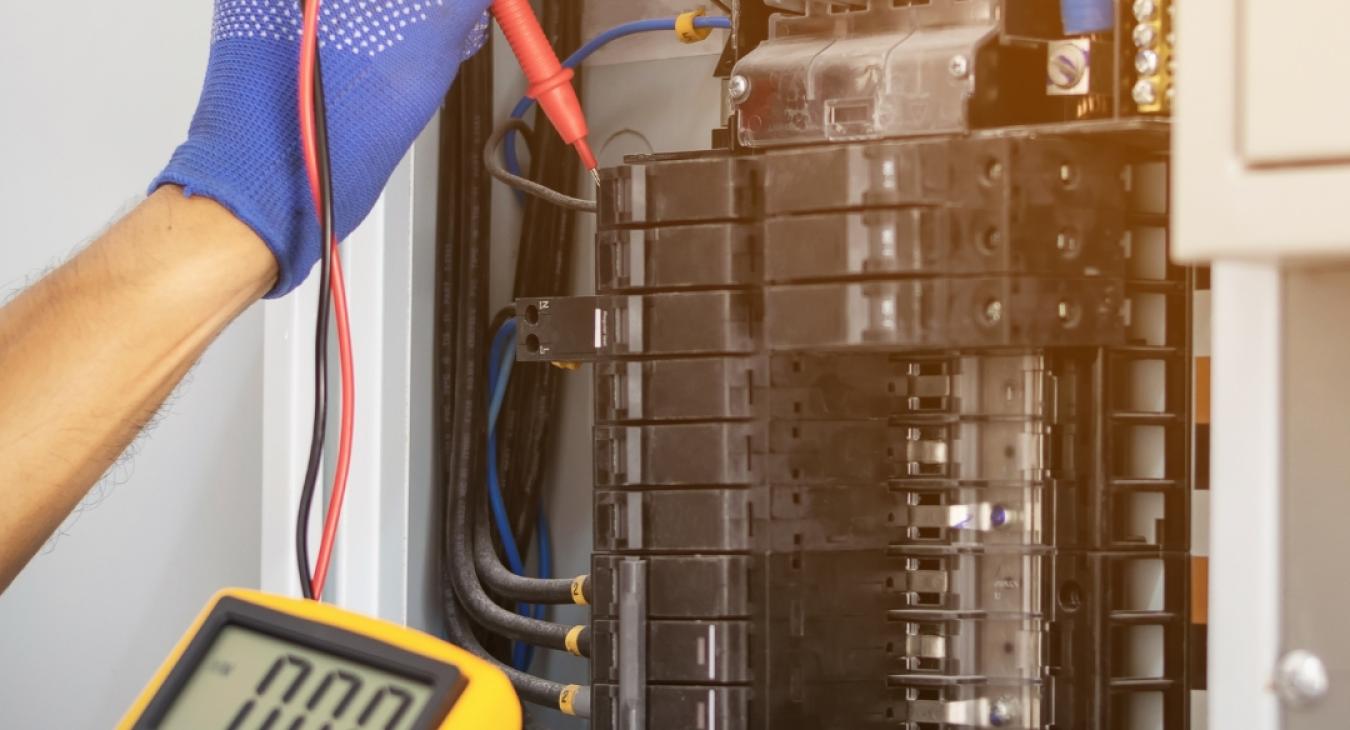
Looking for a Electrical safety tips Electrician?
Fully Qualified And Insured Electricians You Can Trust.
WE WILL turn up for our appointments
WE WILL provide you with a written quote
WE WILL give you honest advice
WE WILL treat your home with respect
0115 647 0335
OR REQUEST A FREE QUOTE
Apr 29, 2023
Commercial electrician near me
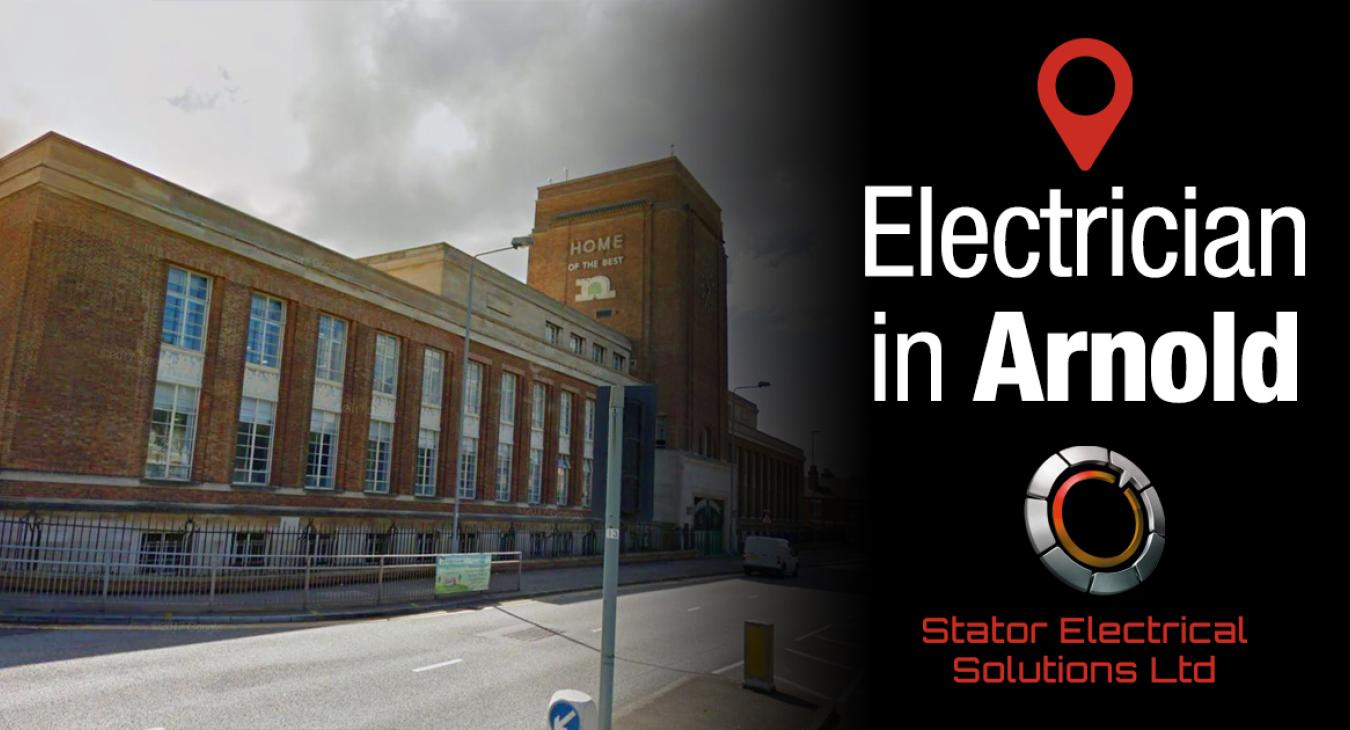
Jul 29, 2021
Electrician in Arnold
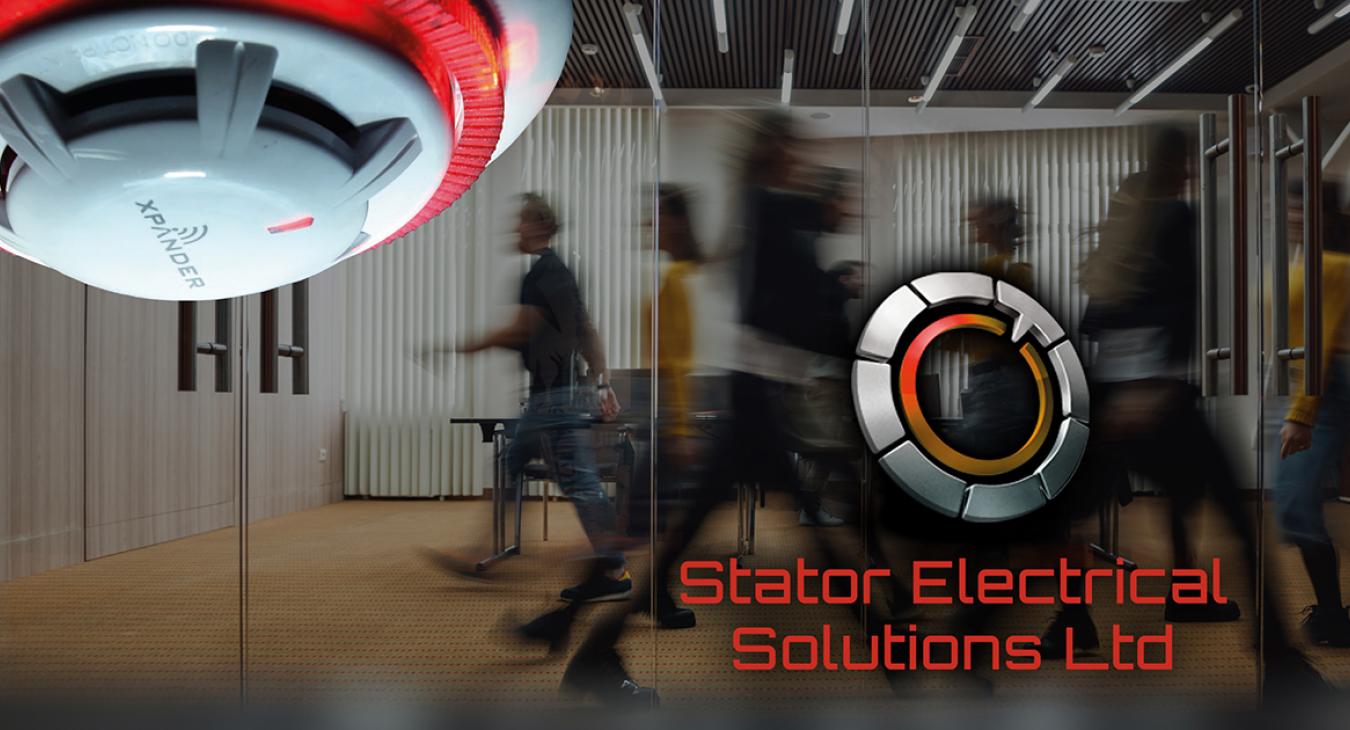
Mar 11, 2021
Comparing Detectors and Alarms: Fire Alarm Systems For Business Premises
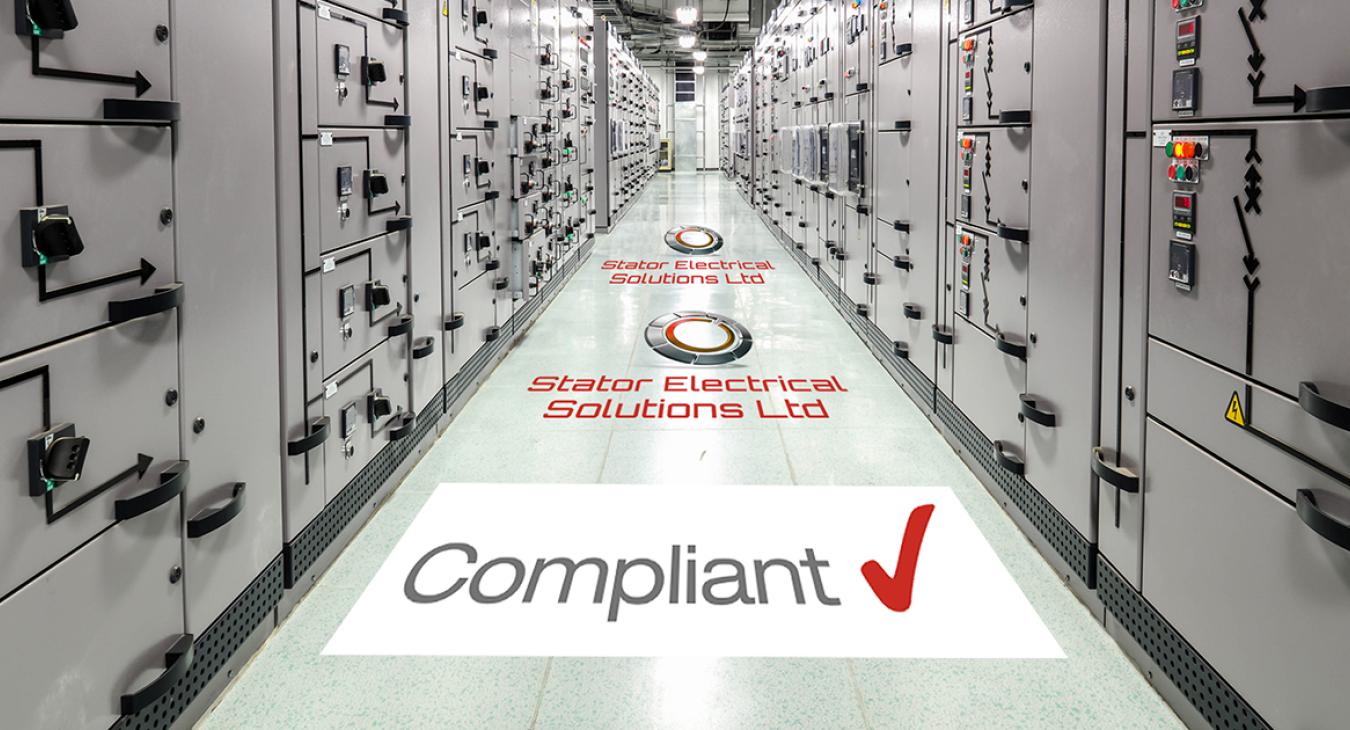
Jan 15, 2021
Business Compliance - More Than Just PAT Testing
Oct 10, 2016
Electrical Safety On Holiday
Jun 10, 2016
How to turn off your electricity in an emergency.
Mar 16, 2016
How To Read an Energy Efficiency Diagram...
Mar 01, 2016
Three home appliances that use the most electricity...
Feb 09, 2016
THREE things to ask before hiring an electrician…
Jan 25, 2016
Emergency Call Out - RCD Burnt Out
Pagination
Page 1
Next page
››
Specialists in...
Air Conditioning
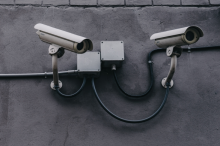
CCTV
EV Car Chargers
Heating
Renewable Energy
Security
Latest blogs and helpful advice
Security Systems for businesses in Nottingham.
Tripping electrics in Derby? When to call…
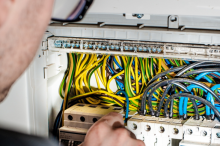
Why choose a specialist industrial electrician?
Electrical fit out Derby
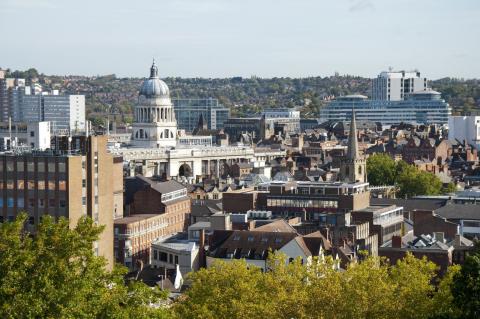
Nottingham Office
info@stator-electrical.co.uk
0115 647 0335
view
">
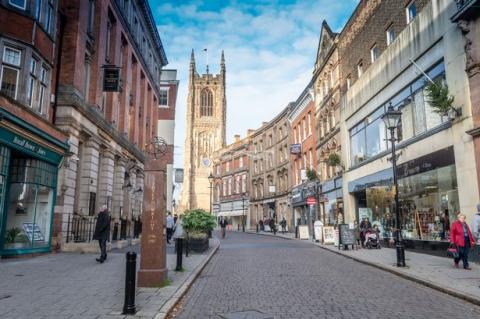
Derby Office
derby@stator-electrical.co.uk
01332 215113
view
">
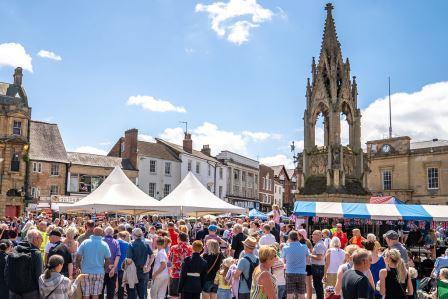
Mansfield Office
mfield@stator-electrical.co.uk
01623 572733
view
">
Chesterfield Office
info@stator-electrical.co.uk
01246 607077
view
">
Eastwood Office - HQ
info@stator-electrical.co.uk
01773 307919
view
">